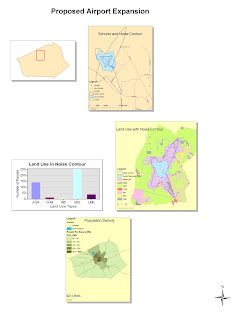
The ArcMap tutorial was my first introduction into GIS. It didn’t take me long to realize the potential of the ArcMap program and GIS. ArcMap is a complex program and I have only began to explore it, but what I have learned so far has shown me the many levels of information that can be stored in a map. These levels are both literal and metaphorical. There are layers of information in the form of layers on the map that can be viewed individually or as a whole. In this tutorial some of the layers were land use, noise contours from the airport, and schools, among many others. There were also layers of information within each of these. When I clicked on the one school that was within the noise contour of the airport I accessed information such as the name of the school. Furthermore, information can be reviewed and conclusions can be made based on that information from the map.
The format of the ArcMap program was surprisingly similar to many other programs I have worked with on my pc. This made it easier for me to understand how it works. While going through the tutorial I found the instructions for the practice maps and exercises easy to follow. The program does seem very complex however because it has so many options and tools. Learning the basics of the program such as labeling, rendering, and positioning was simple, but the program offers much more complex tools that I have yet to learn and that will likely take some time for me to understand.
Once I have spent a considerable amount of time using ArcMap I can see the benefits it will have in terms of GIS. This program is the basis for creating and modifying data maps. Although the process of creating these maps is very time consuming, the uses for the data that is stored in them is tremendous. The map used in the tutorial contained a wealth of information about a fairly small portion of land. This information can be used to guide urban development based on the noise contour of the airport. One thing about the ArcMap system is that it does take a considerable amount of time to create and it is only accessible to people who have the program and have been trained. This is a problem in GIS because programs used in GIS such as ArcMap are not quickly learned and so the information contained in them is not readily accessible.
There are more pros then cons in GIS and the ArcMap program however. The amount of information and the visual and textual presentation of this information allow ArcMap/GIS users to create, summarize, and access large amounts of data for certain areas. This accessibility to data helps us to understand our environment better. GIS makes it easier for us to comprehend the interactions between different aspects of our communities such as schools and transportation. We can then use the information from GIS to improve them. This is possible because GIS allows us to see things like the progression of deforestation over time or increases in population which help us to quantify things we can’t see in our daily lives. The accumulation and presentation of data displayed in GIS, although time consuming to construct, gives users a tremendous amount of information that can be used to improve our environment.
No comments:
Post a Comment